Nashua

Urban Land Surface Temperature

Map_4City_4x3Grid_PUBLISH.png

EXAMPLE USAGE

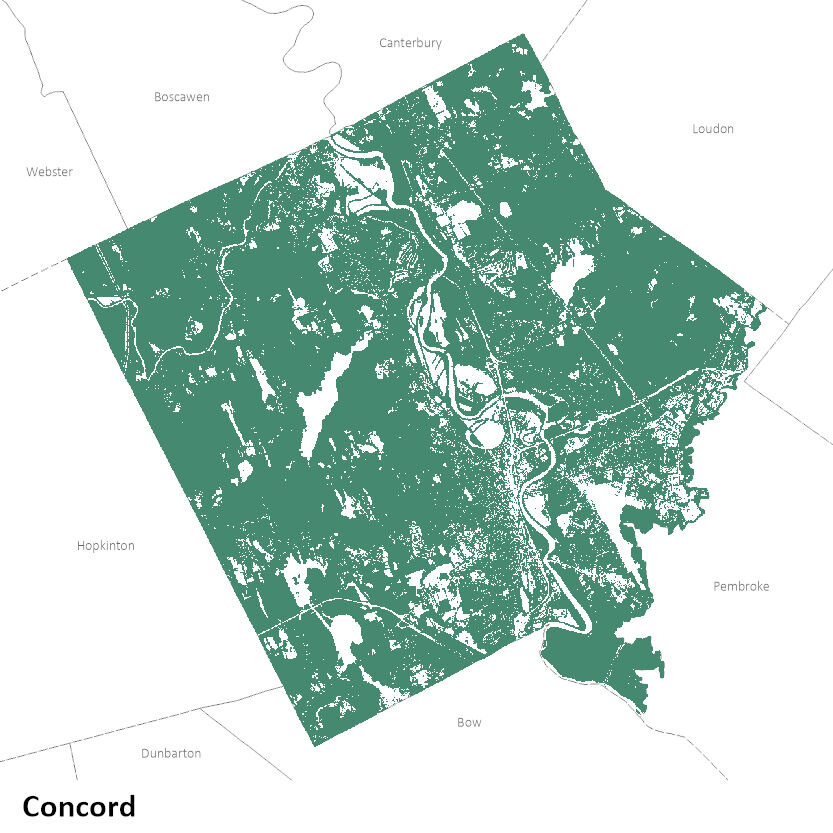
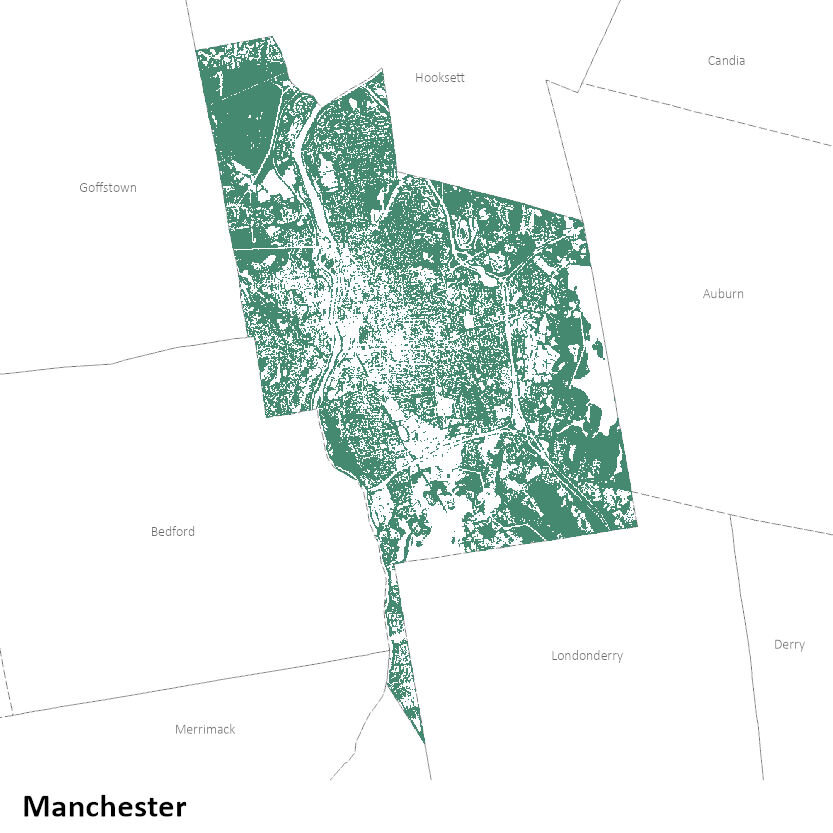
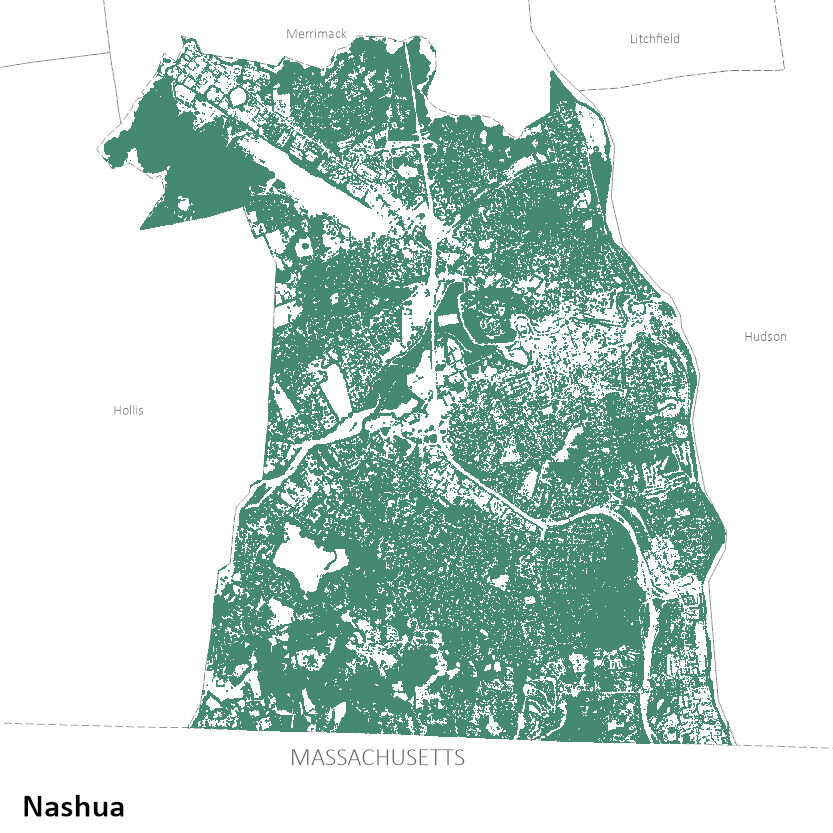
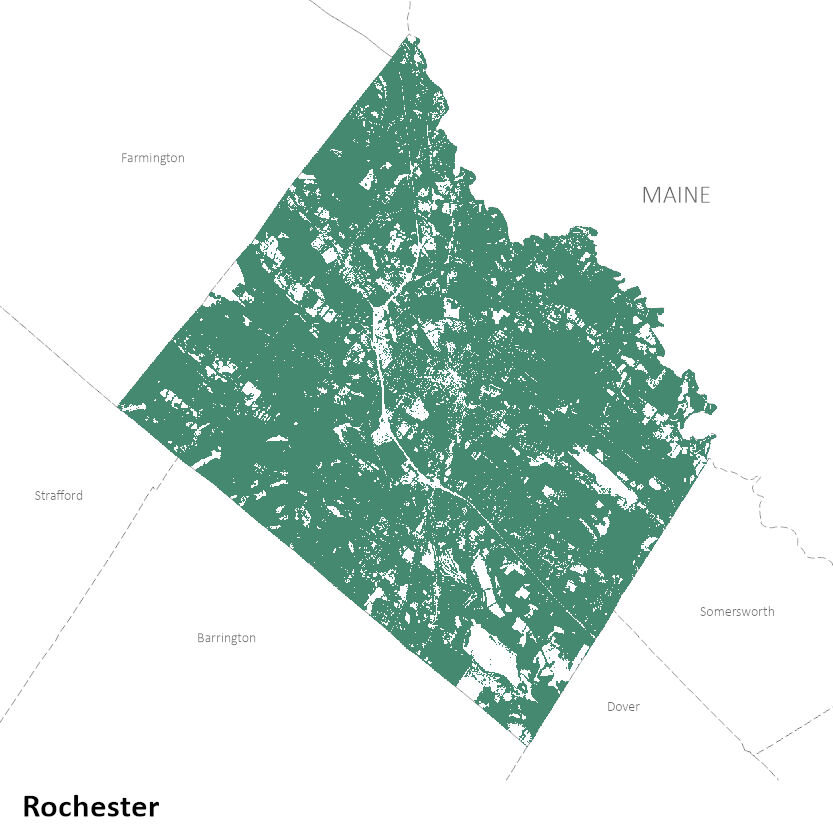
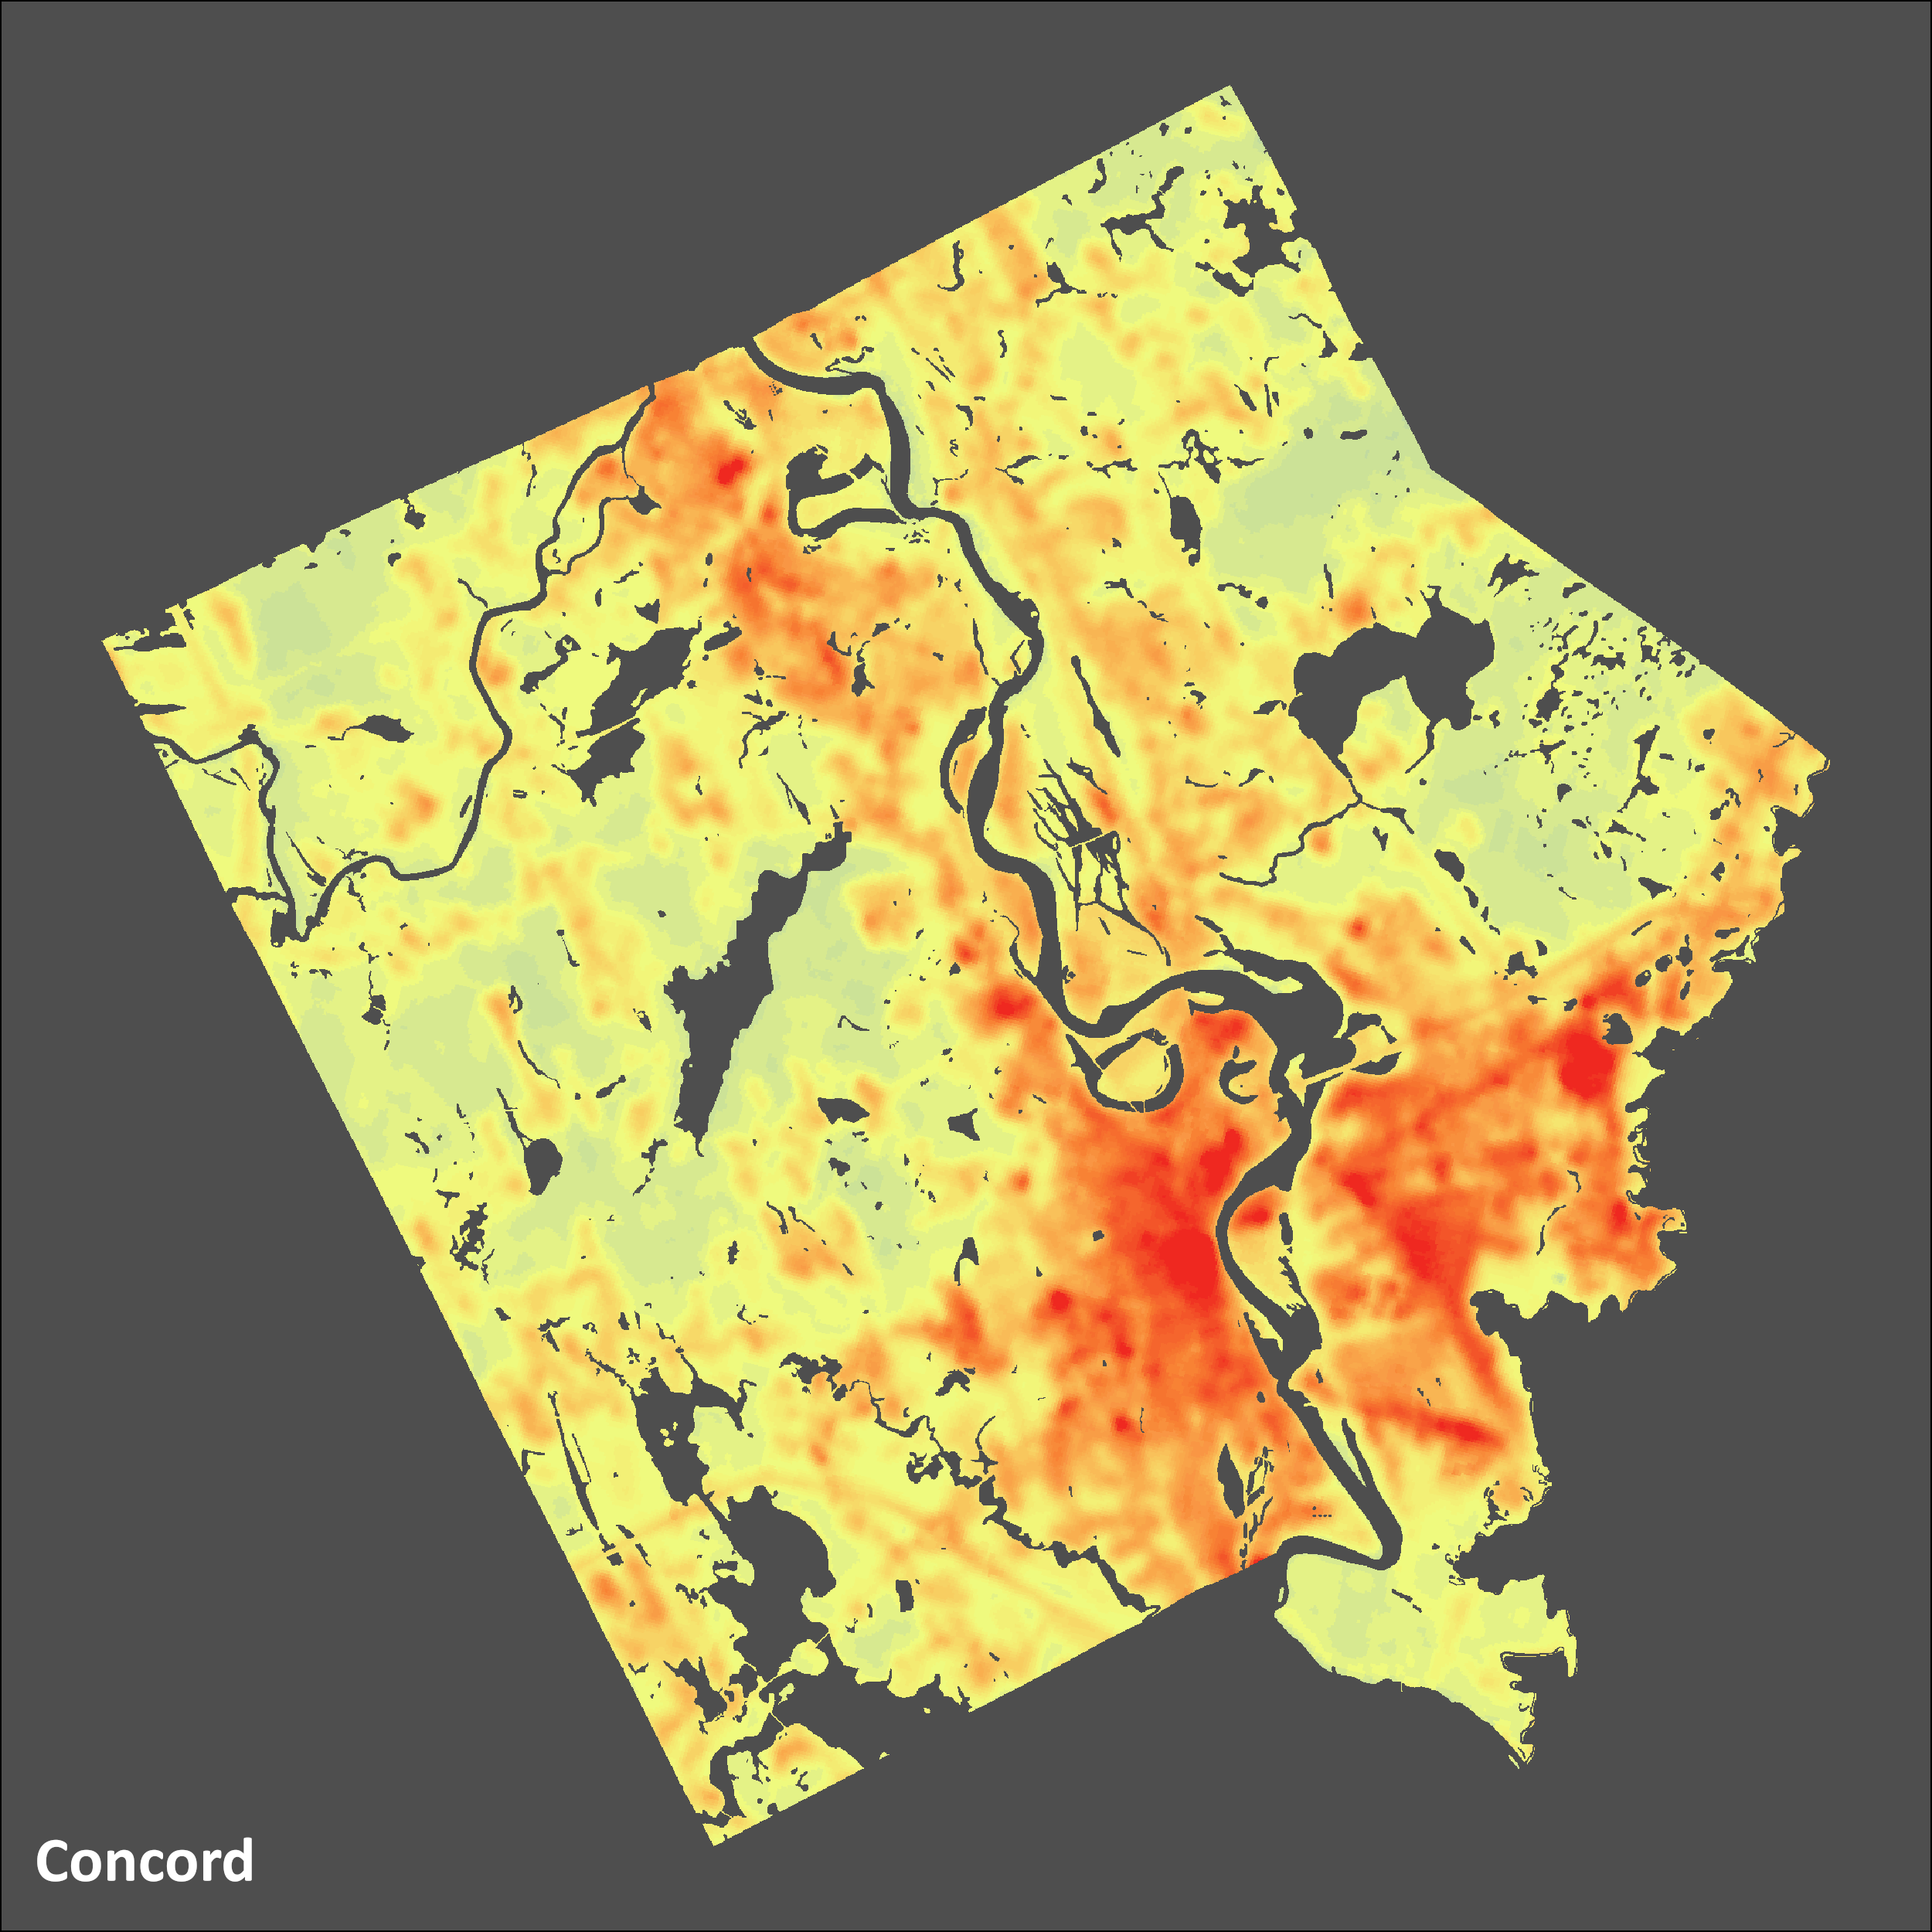
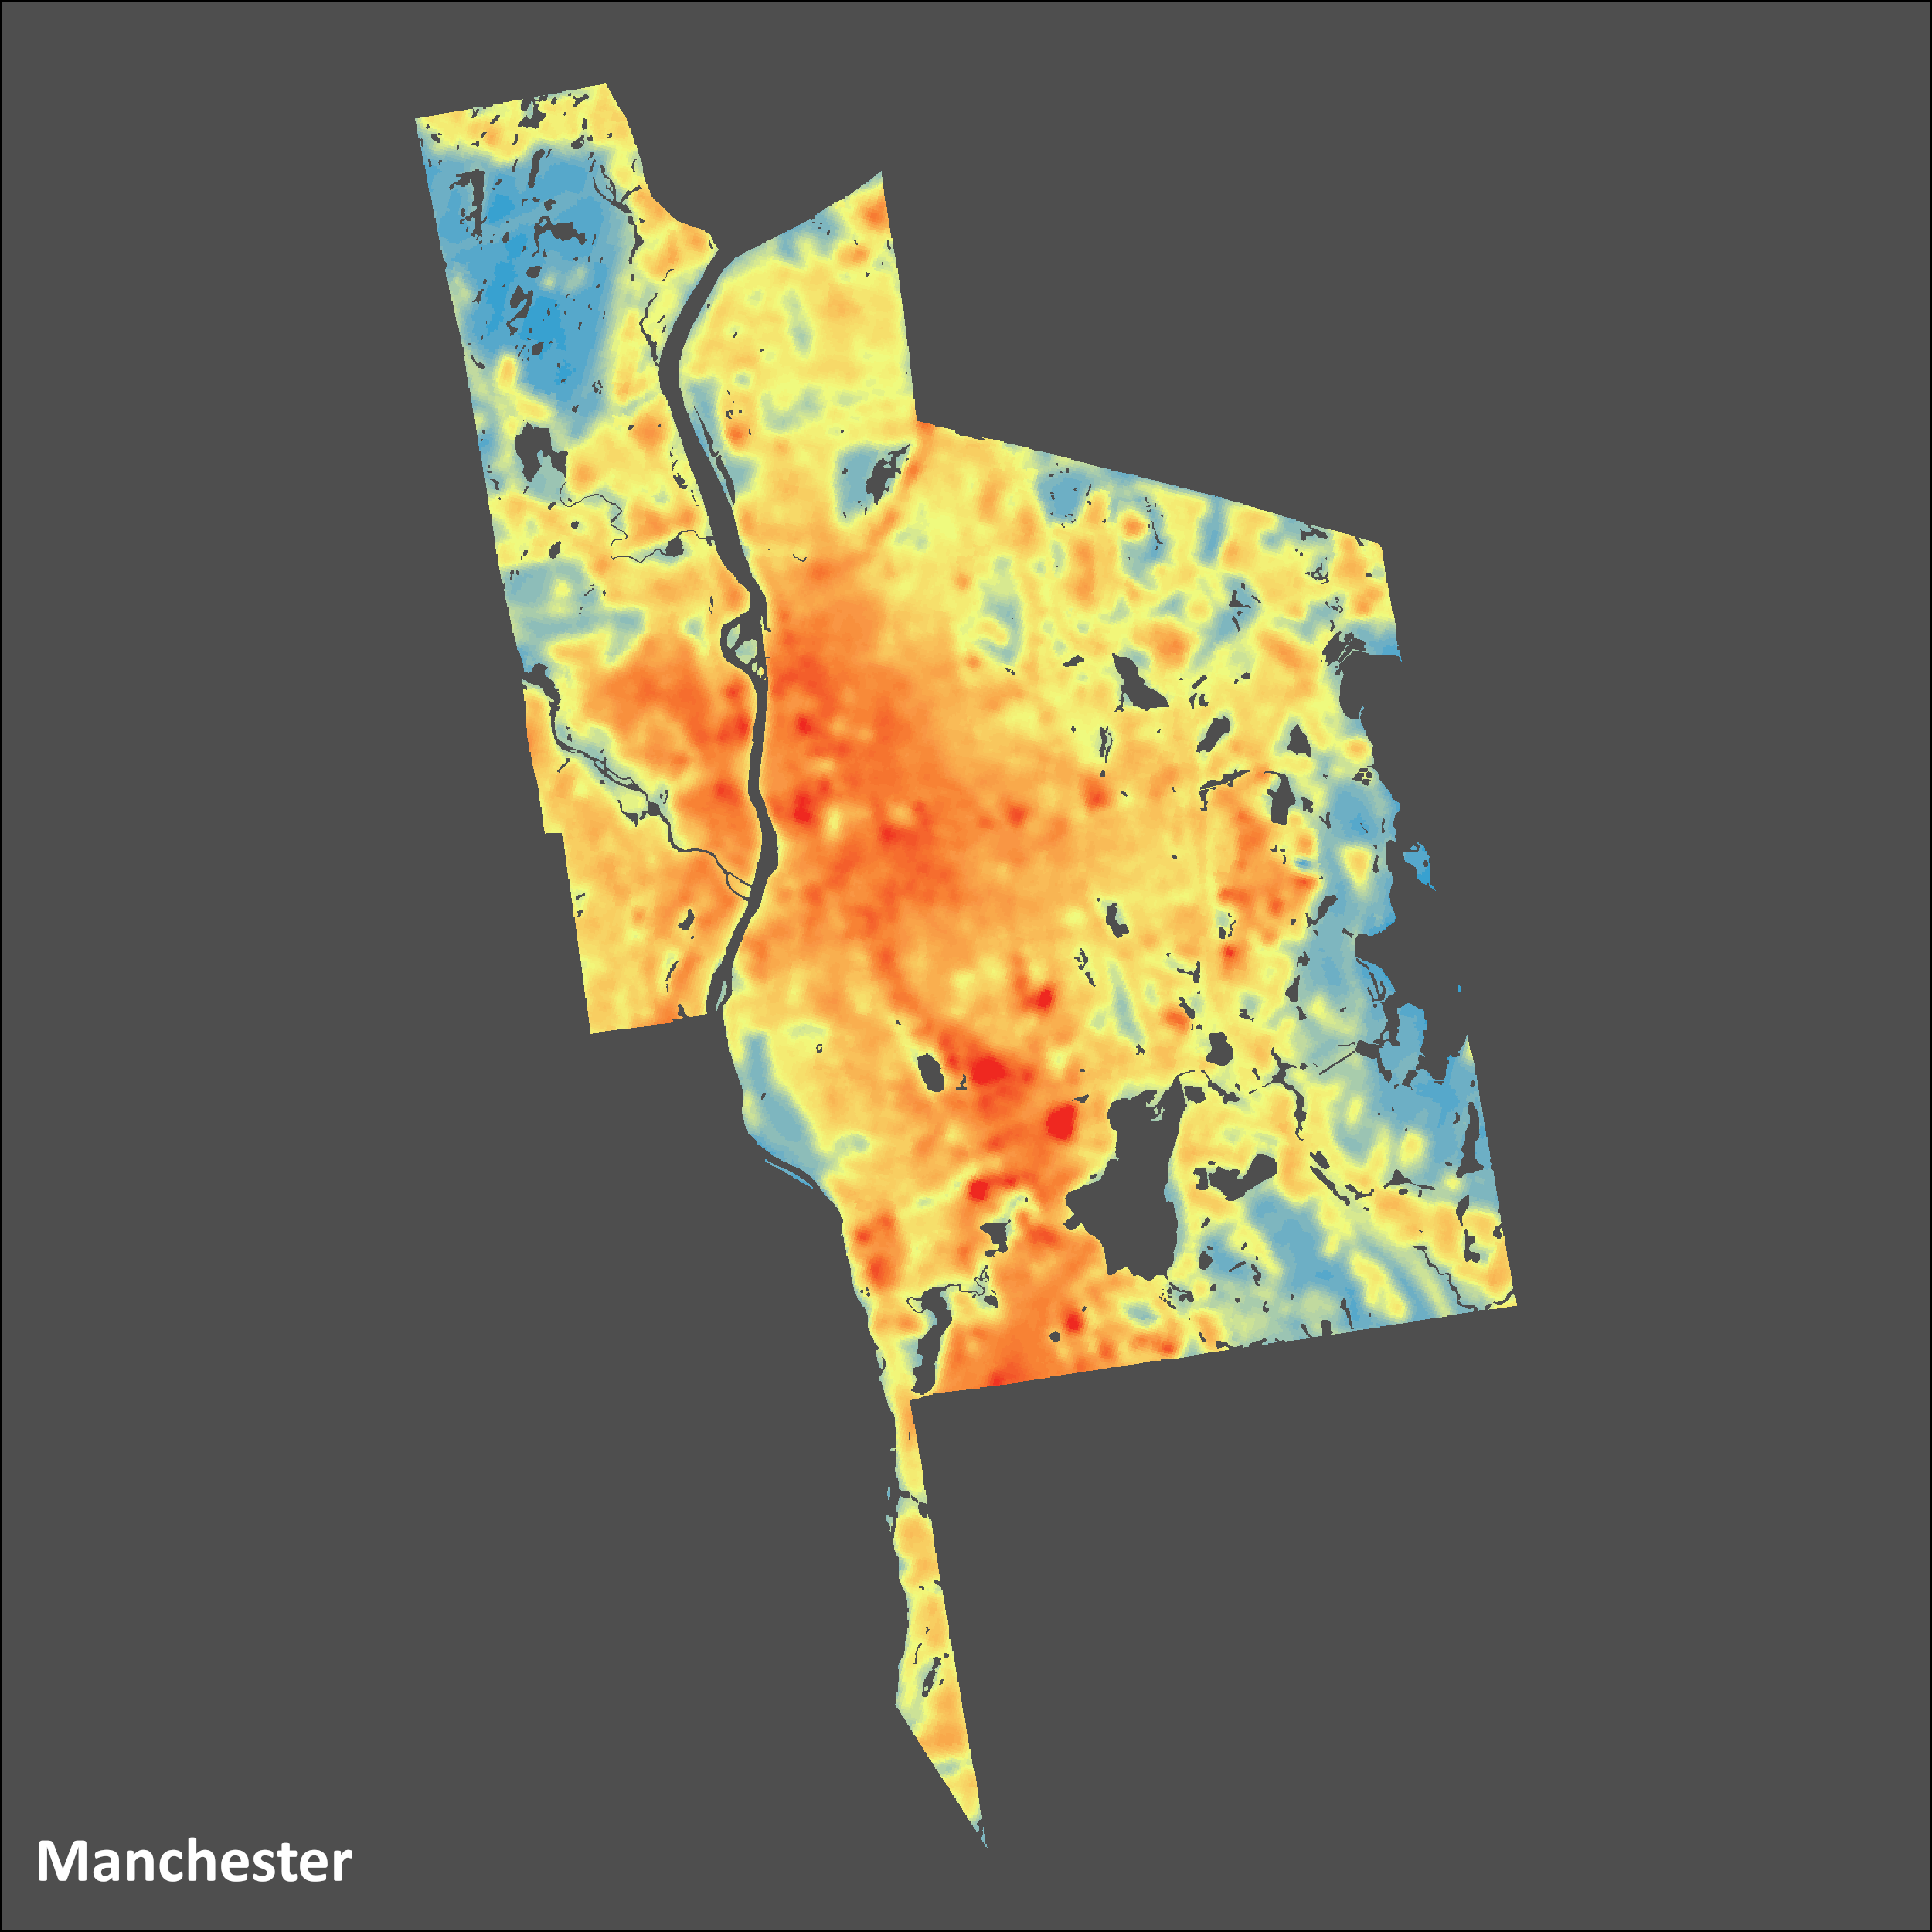
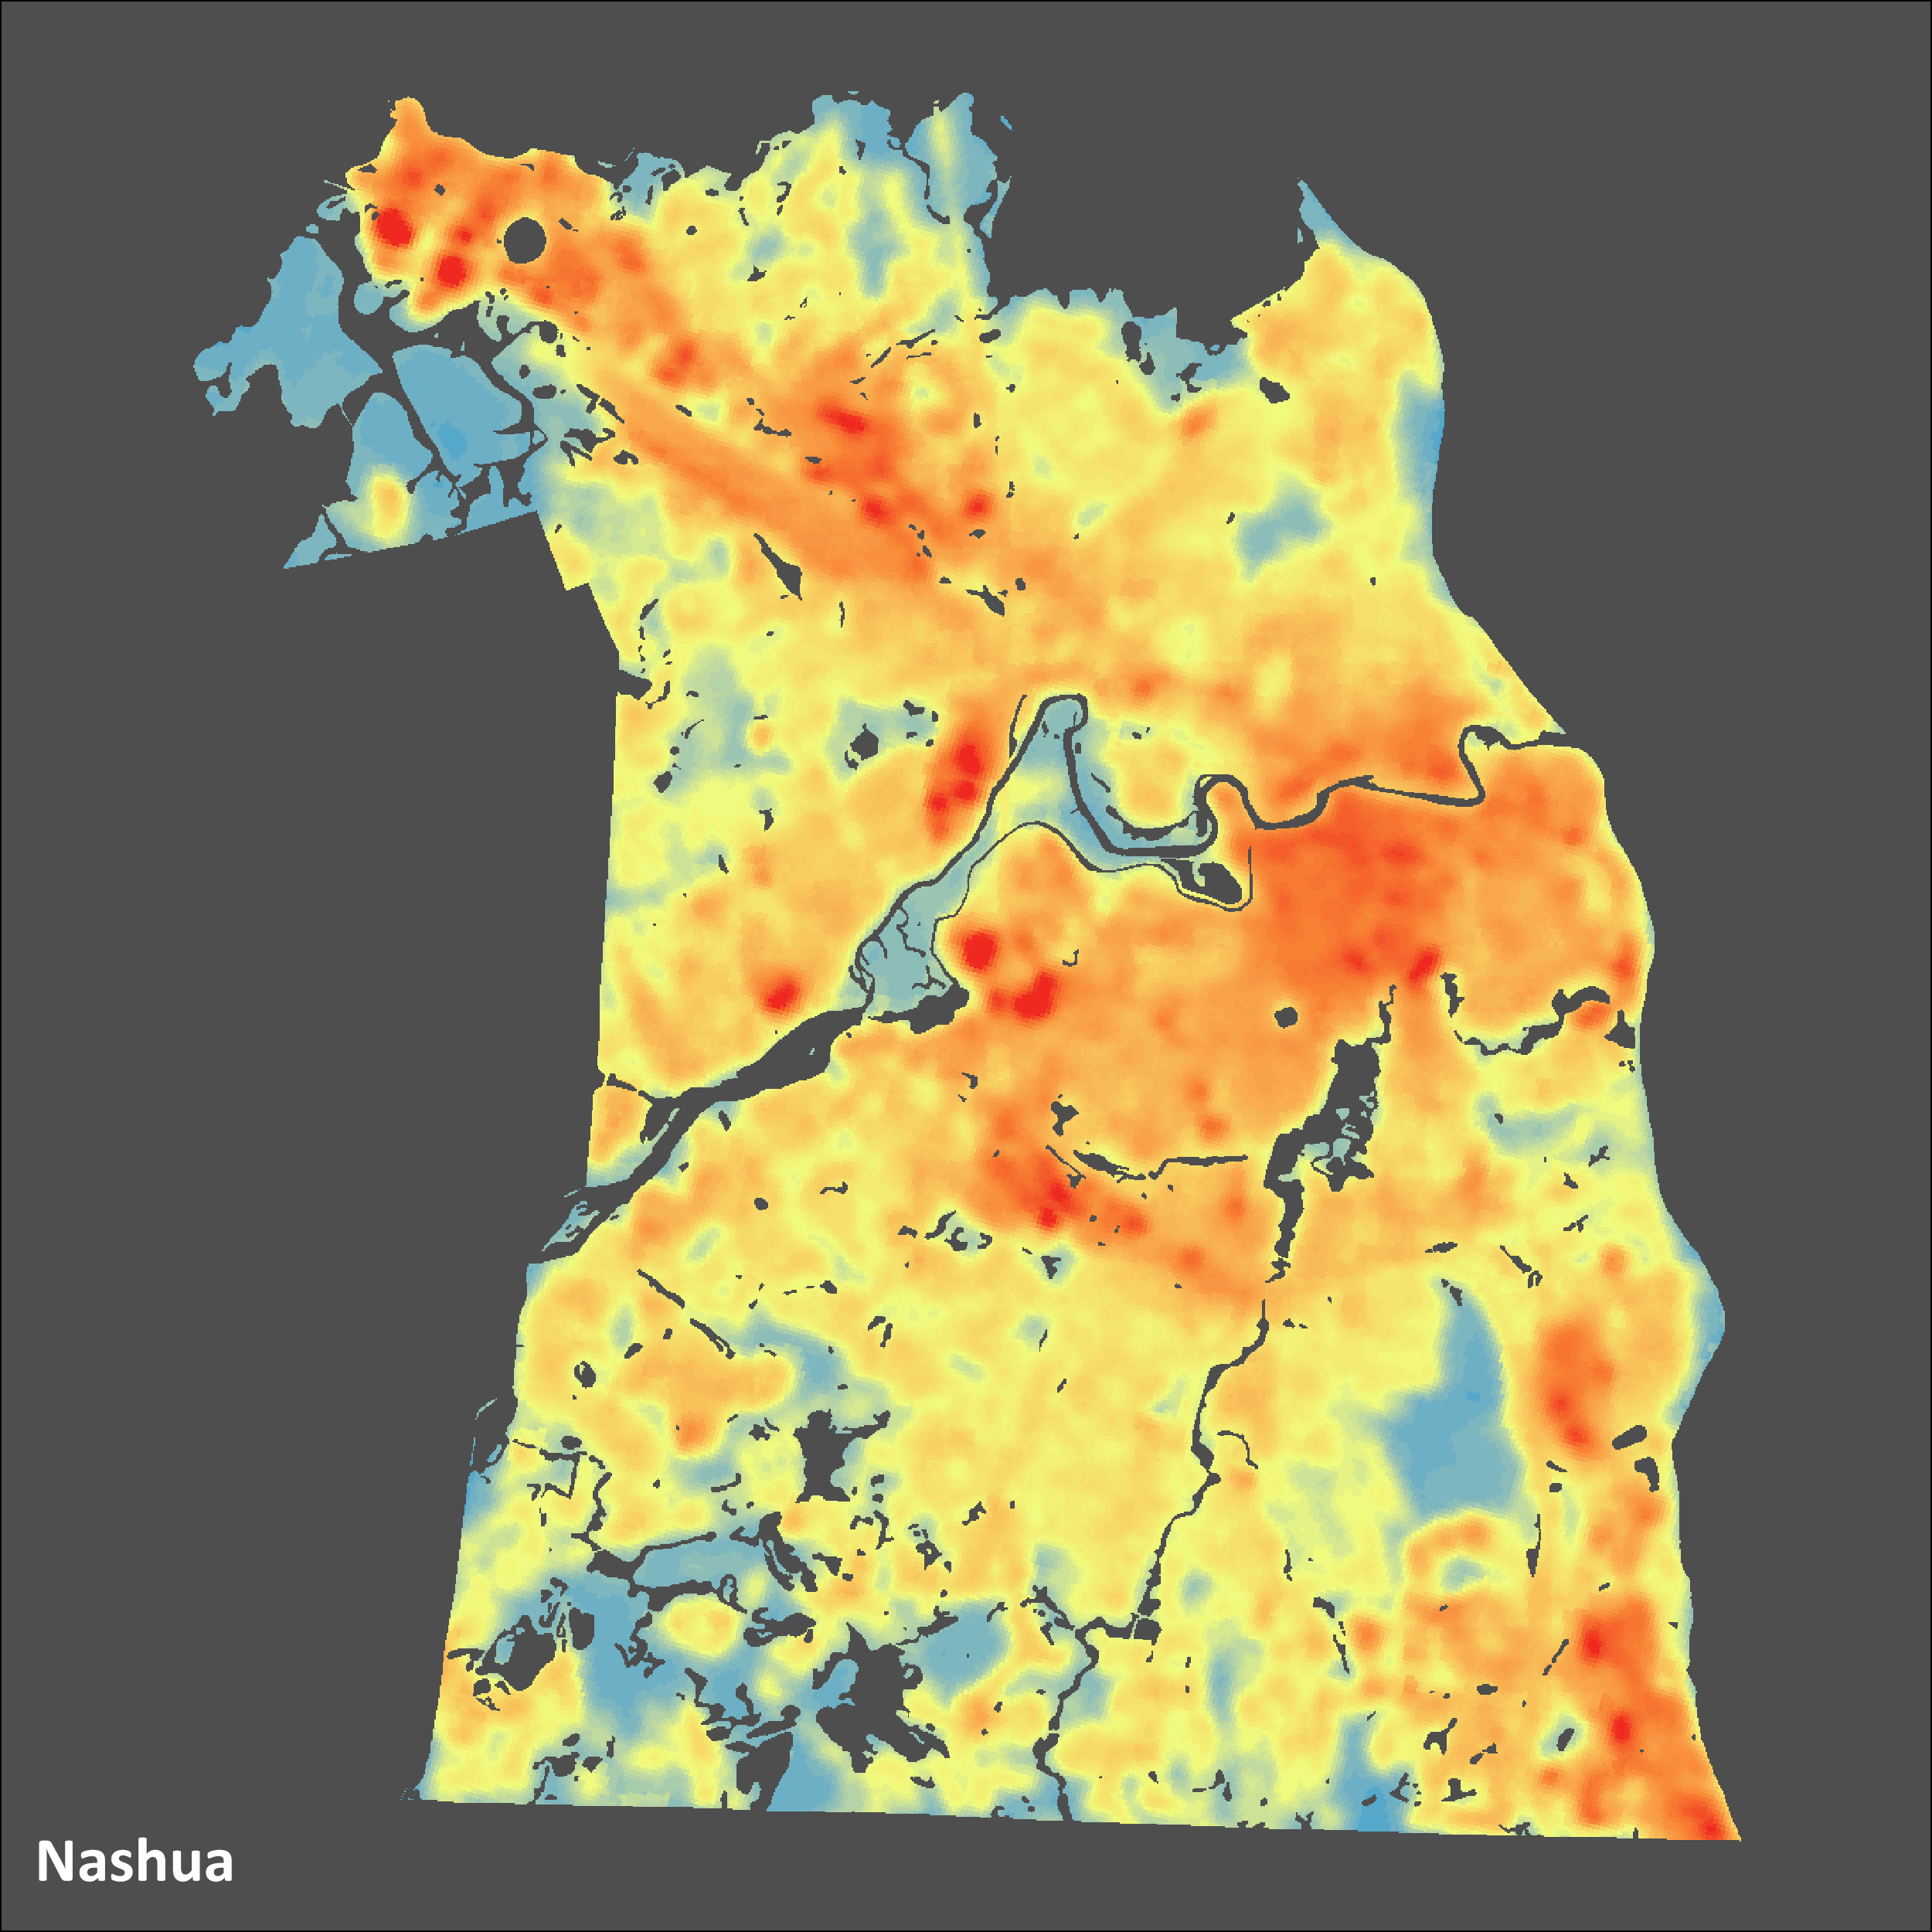
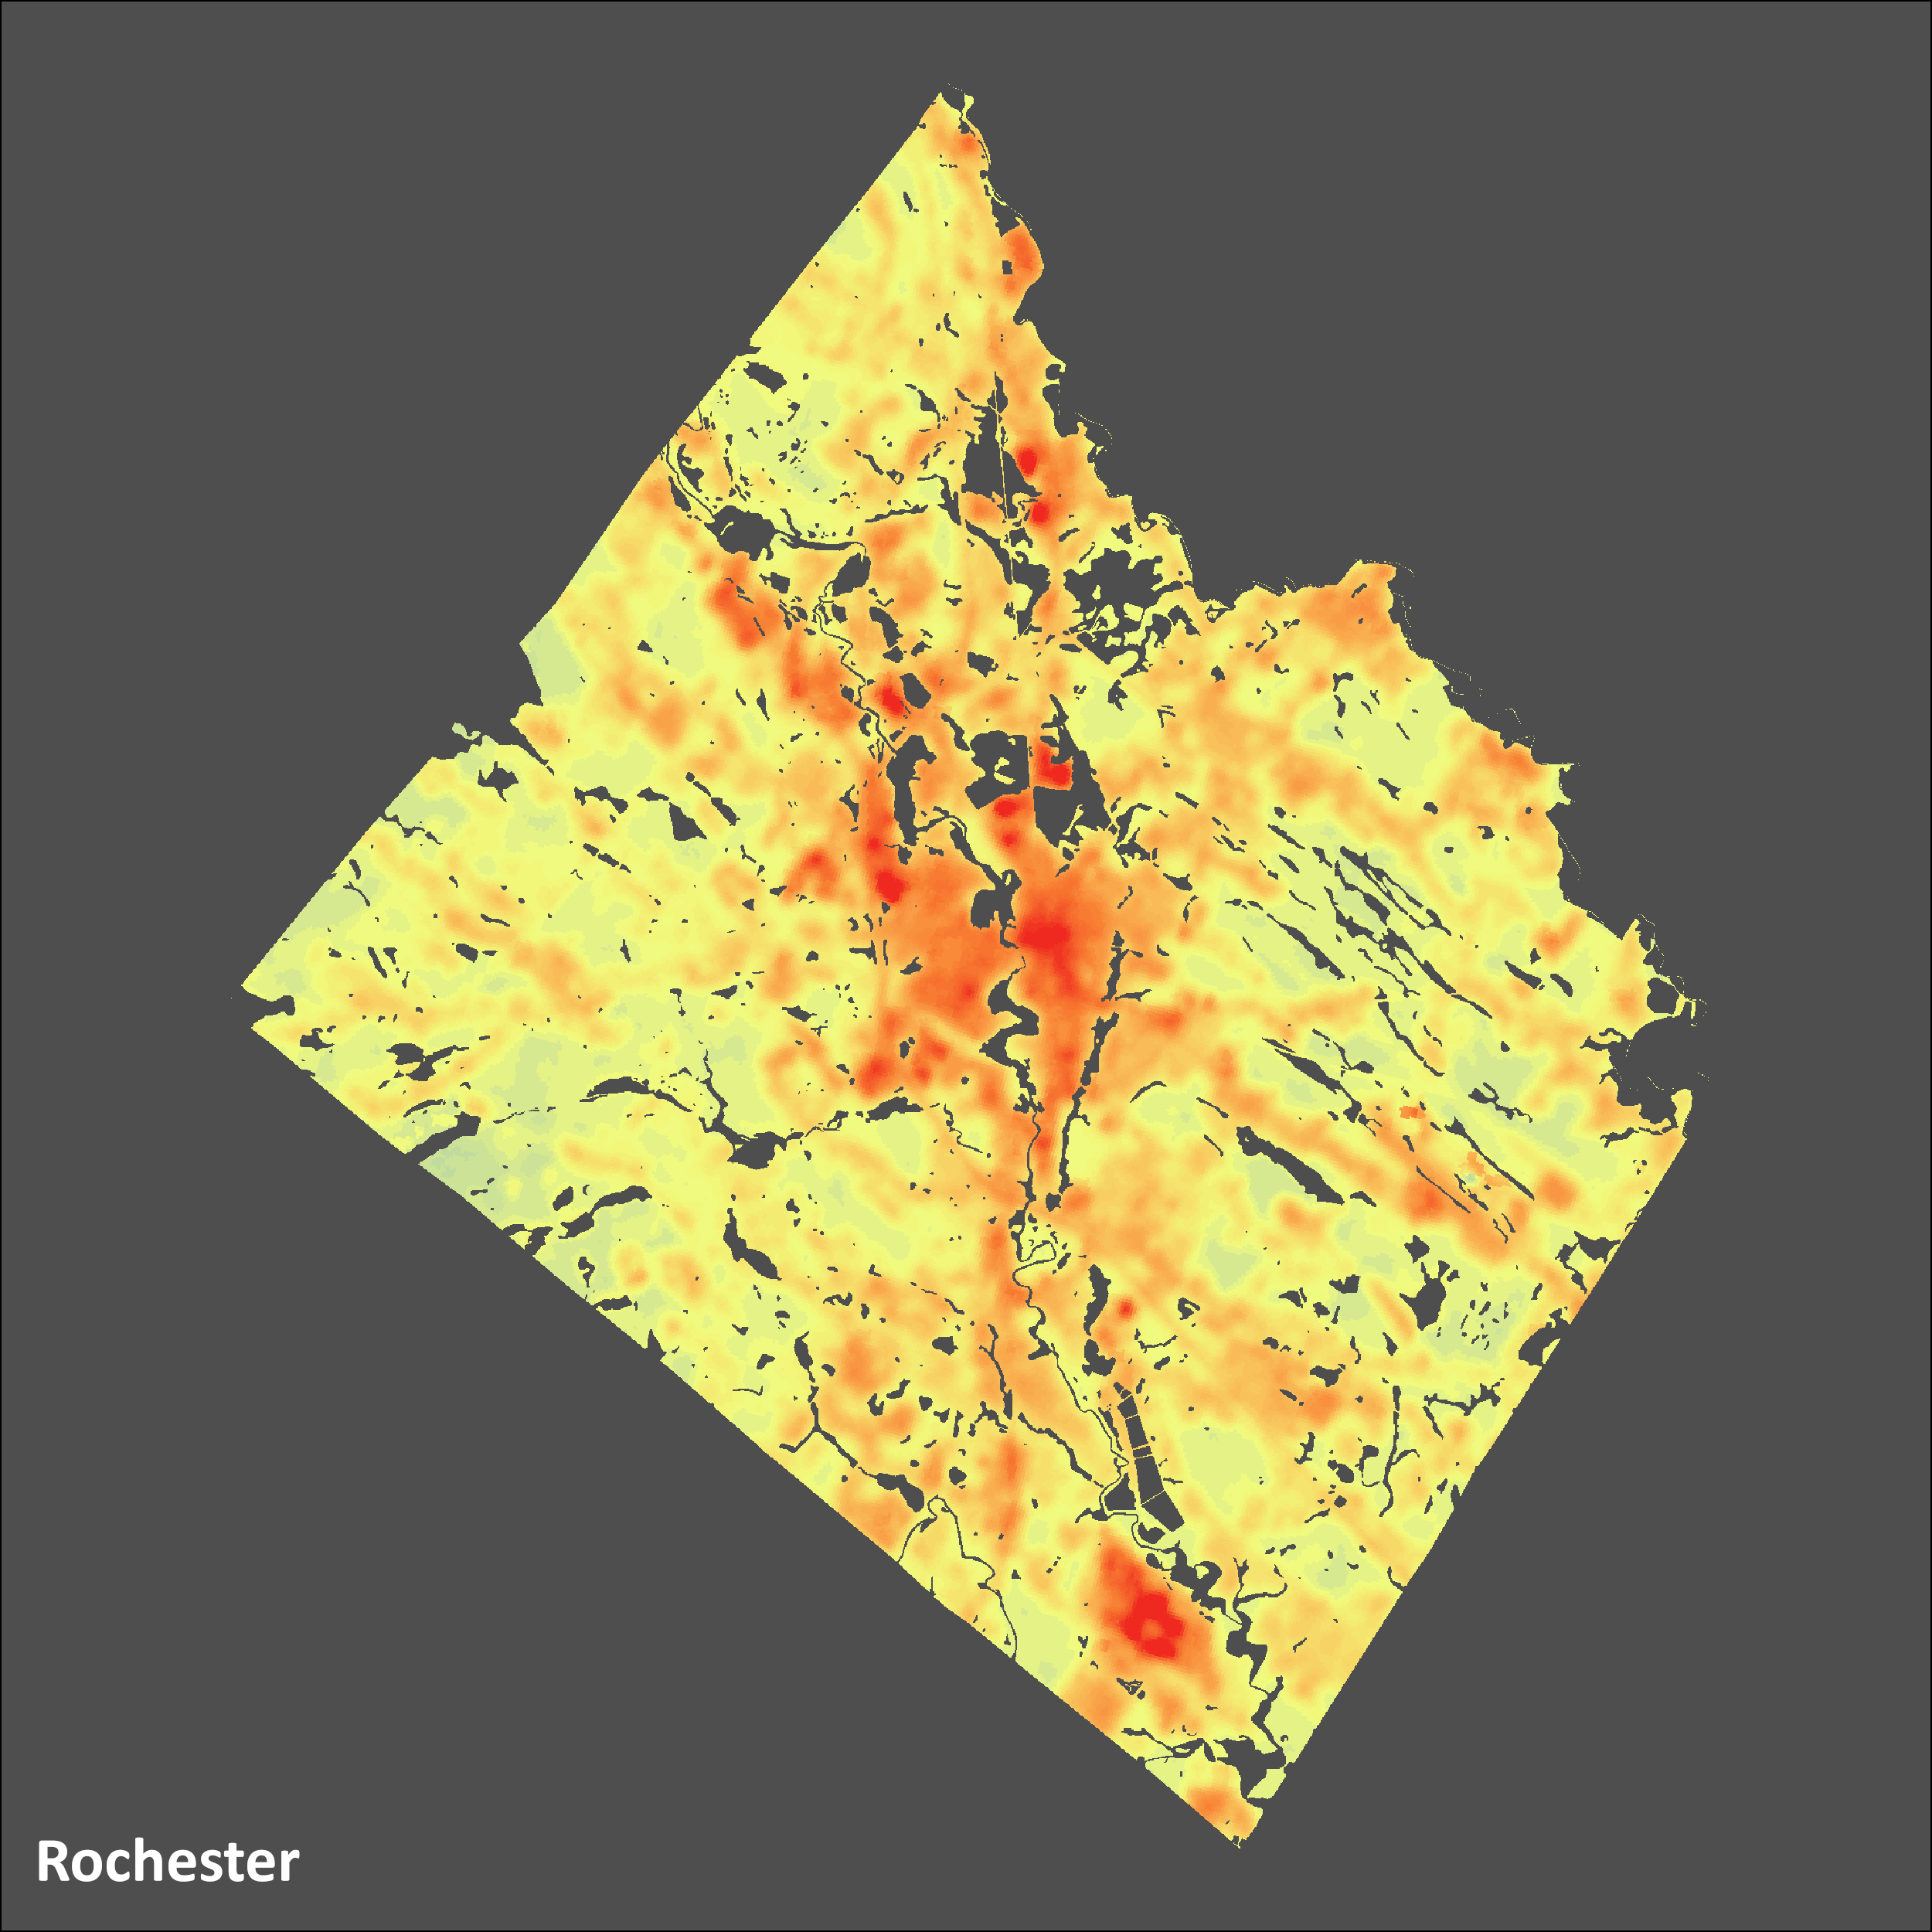
These geo-referenced image files show city-wide variation in mid-summer land surface temperatures for four NH cities: Concord, Manchester, Nashua, and Rochester.

The layer shows how much cooler or hotter each part of the city is relative to the citywide average. We made the layer for a project about heat-related illnesses, which was published in summer 2021.

We made this layer in ArcMap and ArcGIS Pro using analysis-ready data from USGS’s Landsat Provisional Surface Temperature dataset. First, we selected images for three cloudless days in July between 2015 and 2018, using the provided error layers to make sure data for our cities was as distortion-free as possible, and averaged the temperatures across those three days. Second, we removed water bodies to focus our calculations on land. Finally, to emphasize relative temperature differences within each city, we calculated each point’s deviation from the city-wide average temperature.

Type: Spatial

File: Raster (.tif)

Source: USGS

Last Updated: August 2021

Urban Tree Canopy

Map_4City_4x3Grid_PUBLISH.png

EXAMPLE USAGE

These geo-referenced image files estimate the tree canopy for four New Hampshire cities: Concord, Manchester, Nashua, and Rochester.

We made this layer for a project about heat-related illnesses, which was published through the Collaborative in summer 2021. We wanted to estimate tree cover because trees are closely related to several environmental factors at the neighborhood level, including heat. We found, however, that this layer wasn’t available for NH, so we decided to make it ourselves.

We made the layer in ArcMap and ArcGIS Pro by approximating part of a workflow used by the University of Vermont’s Spatial Analysis Lab to identify trees from a combination of LiDAR and satellite imagery (NAIP NDVI).

Our layer identifies most trees in each city, but there are still some errors (e.g., trees that we’ve missed, or other objects that we’ve accidentally labelled as trees), so we think the map is currently only useful for seeing patterns at the level of the city or neighborhood. We’re currently working on making it more accurate.

Type: Spatial

File: Raster (.tif)

Sources: NH GRANIT (LiDAR), USGS (NAIP NDVI)

Last Updated: August 2021